Introduction
I have recently read The Expected Goals Philosophy by James Tippett, where the idea behind “Expected goals” is explained very well. In The Expected Goals Philosophy, the probability that a given team will win based on their expected goals is computed by simulating the game many times, but it can actually be computed analytically which I will do here.
Also in The Expected Goals Philosophy, a phenomenon where a team creating a few good chances will win against a team creating many smaller chances even though the expected number of goals is exactly the same, is introduced and explained. Here I will give a different, and perhaps more rigorous explanation than the one given in the book to this curious phenomenon.
The distribution of xG
First, lets sum up the concept of expected goals: Given the shots a football team has during a match, each with some probability of ending up as a goal, the expected goals (xG) is the expected value of the total number of goals which equals the sum of the probabilities of each shot ending up in goal.
A shot with probability p of ending up in goal can be considered to be a Bernoulli random variable, so the expected goals of a team is the sum of many Bernoulli random variables, one for each shot. It follows that the expected goals of a team has a Poisson binomial distribution.
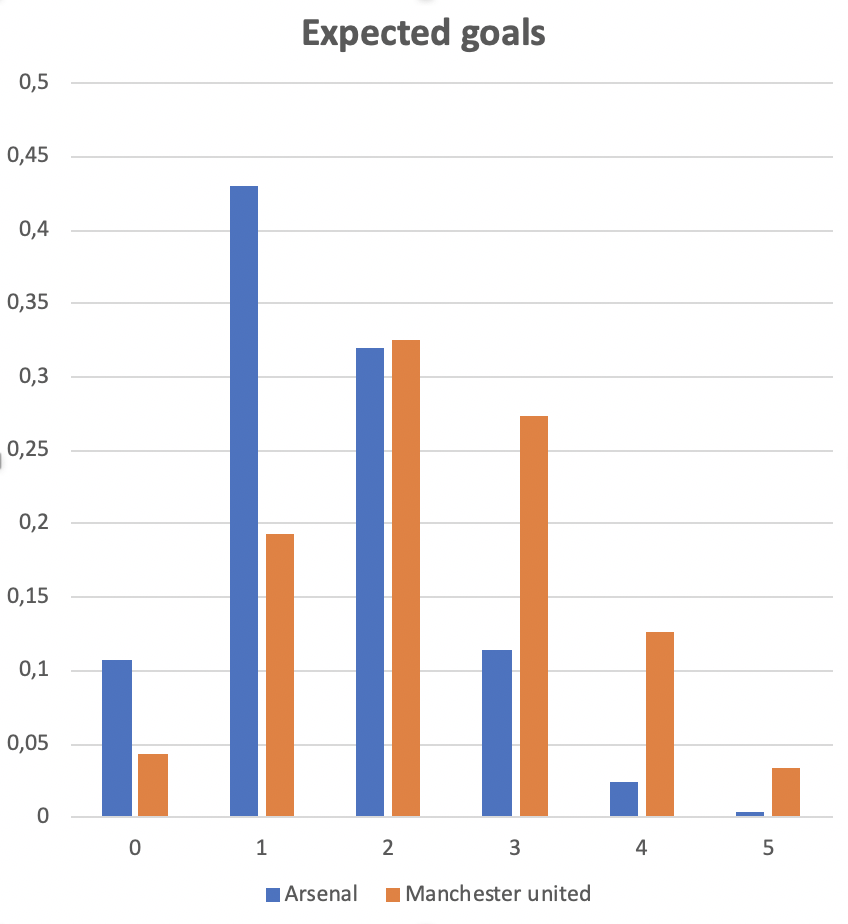
Consider the following example from The Expected Goals Philosophy. In 2019 Arsenal played Manchester United. The shots taken by each team and their estimated probabilities of ending up in goal are listed below:
Arsenal shots: (0.02, 0.02, 0.03, 0.04, 0.04, 0.05, 0.06, 0.07, 0.09, 0.10, 0.12, 0.13, 0.76)
Manchester United shots: (0.01, 0.02, 0.02, 0.02, 0.03, 0.05, 0.05, 0.05, 0.06, 0.22, 0.30, 0.43, 0.48, 0.63)
The expected value of a Poisson binomial distribution is the sum of the probabilities of each experiment (shot in this case), so calculating the expected goals for each team is simple: Arsenal has xG = 1.53 and Manchester United has xG = 2.37. But to consider the distribution of who will win the game, we need to consider the probability mass function of the expected goals which, as we saw, has a Poisson binomial distrbution.
The pmf of a Poisson binomial distributed random variable X with n parameters p_1, \ldots, p_n (shots with estimated xG’s in this case) may be calculated as follows: The probability that exactly k shots succeeds is equal to the sum of all possible combinations of k shots succeeding and the remaining n-k shots missed, e.g.
P(X = k) = \sum_{A \in F_{k,n}} \prod_{i \in A} p_i \prod_{j \in F_{k,n} \setminus A} (1-p_j).Here F_{k,n} is the set of all subsets of size k of \{1,\ldots,n\}. The pmf in this form is cumbersome to compute when the number of parameters (in this case the number of shots) increases. But luckily there are smarter ways to compute them, eg. a recursive method which is used in the code used to compute the actual distribution:
Now computing the probability of the possible outcomes of the game is straight-forward: For each possible number of goals Arsenal could have scored, we consider the probability that Manchester United has scored fewer, more or the same amount of goals. And since the event that Arsenal scores for example one goal and the event that Arsenal scores two goals are disjoint, the probabilities may be summed. Also, the expected goals of the two teams are assumed to be independent, so if we let A denote Arsenals xG and M denote Manchester Uniteds xG we for have:
P(\text{Arsenal wins}) = \sum_{i = 1}^\infty P(A = i) \sum_{j = 0}^{i-1} P(M = j)Say we consider the event that Arsenal has scored two goals. Then the probability that they will win in this case is equal to the probability that Manchester United scored either a single goal or no goals. These probabilities are read from the above chart and added: 0.04 + 0.19 = 0.23.
This computation gives us the following probabilities for a win, draw or loose for Arsenal resp.: 0.18, 0.23, 0.59. These numbers are very close to the probabilities given in the The Expected Goals Philosophy where they were computed running 100.000 simulations.
Skewness of xG
In The Expected Goals Philosophy, a curious phenomenon is presented, namely that a team creating many small chances is more likely to loose to a team creating few large chances, even though the two teams’ expected number of goals are equal. In the book, the phenomenon is explained by the larger variance of the former teams xG, which is correct, but it is perhaps more precise to say, that it is due to the skewness of the distribution.
The example from the book is the case where one team, Team Coin, has four shots each with probability 1/2 of ending up in goal, and another team, Team Die Shots, has 12 shots each with probability 1/6 of ending up in goal. Since the probabilities for each shot ending up in goal are the same in the two cases, the xG for both teams are binomial distributed, which is somewhat simpler than the Poisson binomial distribution. A plot similar to the one above looks like this:

Note that Team Die’s is skewed to the right. In general, for binomial distributions, the distribution is symmetric if p = 0.5. But if p > 0.5, the distribution is skewed to the left (because the skewness is negative) and if p < 0.5, the distribution is skewed to the right (because the skewness is positive). In this case, Team Die’s distribution is skewed to the right so it has more of its mass to the left of the mean, meaning that the probability of scoring few goals is bigger than the probability of scoring more. Team Coin’s distribution, on the other hand, is completely symmetric (because the skewness is 0), meaning that the probability of scoring fewer goals than the mean is exactly the same as scoring more. Since the mean of the two are the same, the result is that Team Coin has a higher probability of ending up the winner.
The code for computing the distribution of the outcome of a football game based on the expected goals is available here.