Turtle graphics is a method for generating images from integer sequences using very simple rules. The drawing is done by a “turtle” which moves and draws on a plane according to some rules. At any point in time, the turtle has a position and a direction, but no other state.
For example, consider the Thue-Morse sequence defined by
Now define a turtle by the following rules. For each 0 in the sequence, the turtle rotates by \pi and for each 1, the turtle moves ahead one unit and then rotate by \frac{\pi}{3}. This gives the Koch snowflake:

Hans Zantema has written a very nice paper on turtle graphics, including criteria for rules to ensure that the picture drawn by a turtle is either finite or self-similar. The paper also includes a number of examples, including the so-called rosettes which are defined over a binary sequence defined by the morphisms
starting with 0. One example of a rosette is the turtle which for each 0 rotates 7 \pi / 9 and then moves, and for each 1 it rotates -2\pi / 9 and moves. This gives the following picture.

Below is a 6-minute animation of how the turtle moved while drawing the rosette.
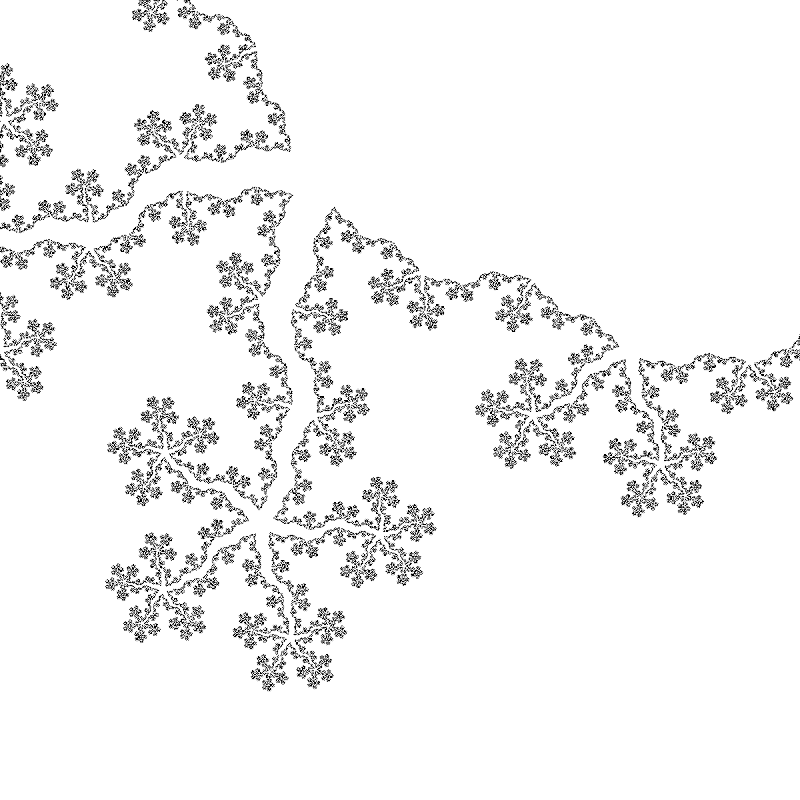
The method can also produce more fractal-like images, like the one below which is also from Zantemas paper. Here the sequence is defined by
where 0 rotates the turtle by 7\pi / 18 and 1 rotates the turtle -7 \pi / 12.
The code used to generate the pictures and video are available here.